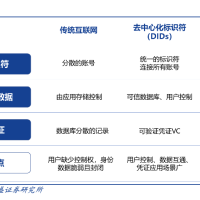
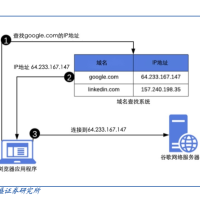
Linux 下简便的方法来查找服务状态、健康检查和服务器资源利用率等等。
注:适用于单体架构。
通过使用这种方法,我们可以使用单个工具检查服务器的健康状态、服务状态和服务器详细信息。只需更改脚本以添加其他服务或使用相同的模板即可。此外,通过设置定时任务,我们可以在出现问题时收到通知。
让我们开始吧!
编写脚本
$ vim linuxmi
#! /bin/bash#color notesNC='\033[0m'GREEN='\033[0;32m'RED='\033[0;31m'YELLOW='\033[0;33m'cyan='\033[0;36m'yellow='\033[0;33m'#Sectioning .........echo -e "${YELLOW}---------------------------------------------------------------------------------------------------------------${NC}"echo"Server details:"echo -e "${YELLOW}---------------------------------------------------------------------------------------------------------------${NC}"#fetching basic specs from the server(user,ip,os)user=`whoami`echo -e "${cyan}User:${NC}$user"hostname=`hostname`echo -e "${cyan}hostname:${NC}$hostname"ip=`hostname -I`echo -e "${cyan}IP address:${NC}$ip"os=`cat /etc/os-release | grep 'NAME\|VERSION' | grep -v 'VERSION_ID' | grep -v 'PRETTY_NAME' | grep NAME`echo -e "${cyan}OS:${NC}$os"#Sectioning.....echo -e "${YELLOW}---------------------------------------------------------------------------------------------------------------${NC}"echo"Service status:"echo -e "${YELLOW}---------------------------------------------------------------------------------------------------------------${NC}"sleep 1#checking tomcat statusecho -e "${yellow}1) Tomcat${NC}"#grepping tomcat status from ps auxpp=`ps aux | grep tomcat | grep "[D]java.util"`if [[ $pp =~ "-Xms512M" ]];thenecho -e " Status: ${GREEN}UP${NC}"elseecho -e " Status: ${RED}DOWN${NC}"fiecho""#function to check apache is running or not!functionapache(){echo -e "${yellow}2) Apache-httpd${NC}"#grepping apache status from ps auxhttpd=`ps aux | grep httpd | grep apache`if [[ $httpd =~ "apache" ]];thenecho -e " Status: ${GREEN}UP${NC}"elseecho -e " Status: ${RED}DOWN${NC}"fi}#function to check elastic is running or notfunctionelastic(){echo -e "${yellow}3) Elasticsearch${NC}"#grepping elasticsearch status from ps auxelastic=`ps aux | grep elasticsearch`if [[ $elastic =~ "elastic+" ]];thenecho -e " Status: ${GREEN}UP${NC}"elseecho -e " Status: ${RED}DOWN${NC}"fi#function to check mysql is running or not}functionmysql(){echo -e "${yellow}4) Mysql${NC}"#grepping mysql status from ps auxmysql=`ps aux | grep mysqld`if [[ $mysql =~ "mysqld" ]];thenecho -e " Status: ${GREEN}UP${NC}"elseecho -e " Status: ${RED}DOWN${NC}"fi}functiondocker(){echo -e "${yellow}5) Docker${NC}"#grepping docker status from ps auxdocker=`systemctl status docker | grep dead`if [[ $docker =~ "dead" ]];thenecho -e " Status: ${GREEN}UP${NC}"elseecho -e " Status: ${RED}DOWN${NC}"fi}#calling functionsapacheecho""elasticecho""mysqlecho""dockerecho""#Sectioning............#Fetching mem and cpu informationsecho -e "${YELLOW}---------------------------------------------------------------------------------------------------------------${NC}"echo"Memory Details:"echo -e "${YELLOW}---------------------------------------------------------------------------------------------------------------${NC}"sleep 1#view mem infofree -h#get uptime detailsuptime=$(uptime | awk '{print $3,$4}' | cut -f1 -d,)echo -e "${cyan}System Uptime:${NC} :$uptime"#Fetching the load averageloadaverage=$(top -n 1 -b | grep "load average:" | awk '{print $10 $11 $12}')echo -e "${cyan}Load average:${NC}: $loadaverage"echo -e "${cyan}The top 10 services with high resource usage are listed below.${NC}"#Get top services with high resource utilizationps -eo pid,ppid,cmd,%mem,%cpu --sort=-%mem | head#sectioning...........#Fetching server space details!echo -e "${YELLOW}---------------------------------------------------------------------------------------------------------------${NC}"echo"Server space Details:"echo -e "${YELLOW}---------------------------------------------------------------------------------------------------------------${NC}"#View disk space detailsdf -hecho"----------------------------------------------------------------------------------------------------------------"
采集失败,请手动处理
https://app.yinxiang.com/shard/s36/res/87df5ae0-16f6-4a50-a297-0d748dca9d0f/640.png
2、我们可以将该脚本转换为全局命令,将文件移动到 sbin 目录,并赋予执行权限。
linuxmi@linuxmi ~/www.linuxmi.com% sudo cp linuxmi /usr/sbin/[sudo] linuxmi 的密码:linuxmi@linuxmi ~/www.linuxmi.com% sudo chmod +x /usr/sbin/linuxmilinuxmi@linuxmi ~/www.linuxmi.com
3、现在您可以在 shell 的任何位置调用该脚本。
linuxmi@linuxmi ~/www.linuxmi.com% linuxmi
示例输出如下:
采集失败,请手动处理
https://app.yinxiang.com/shard/s36/res/3feb2359-77b8-4602-84ea-bcec44bb7cf5/640.png
采集失败,请手动处理
https://app.yinxiang.com/shard/s36/res/18a0a38b-3716-49ee-9e04-7cedec1c0931/640.png
优势
-
只需一个命令就可以轻松访问完整的服务器信息,并且还可以在出现问题时安排警报通知。
-
编辑脚本并添加服务非常简单。
-
显示有关正在运行的进程、磁盘空间、宕机时间、内存详细信息、高进程列表等的详细信息。